What Dominant-Color Percentages Actually Mean
Demystify color extraction percentages. Learn how pixel area coverage is calculated, why percentages sum to exactly 100%, and how visual weight differs from mathematical dominance.
Color Picker & Palette Generator
Extract dominant colors from images and generate harmonic color schemes.
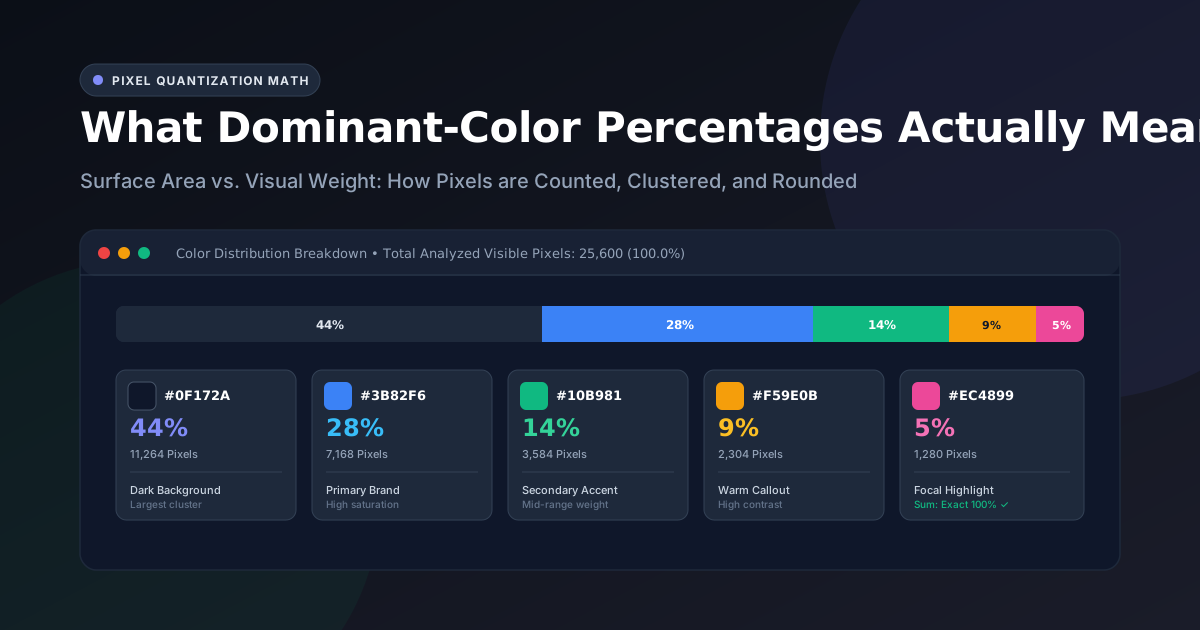
When you upload an image to an automated color extractor like the UtilityKit Color Picker, you receive a set of dominant color swatches accompanied by exact percentage values—such as 42%, 28%, 15%, 10%, and 5%.
At first glance, it is easy to assume that the color with the highest percentage is the "most important" color in the image, or that you should immediately make it the primary color of your brand or application.
However, interpreting dominant-color percentages requires understanding the distinction between mathematical pixel surface area and perceptual visual weight. In this article, we examine how color percentages are calculated, how rounding errors are eliminated, and how to translate these numbers into effective UI designs.
How Dominant Percentages are Calculated
Every digital image is an array of picture elements (pixels), each defined by Red, Green, Blue, and Alpha (RGBA) values. When an image is loaded into the Color Picker:
- Downsampled Sampling Grid: To ensure instantaneous performance across devices, the image is rendered onto an offscreen canvas bounded by a maximum dimension of
160px. This yields a manageable grid of up to 25,600 pixels. - Alpha Filtering: Pixels with an alpha channel below 128 (transparent and translucent pixels) are discarded, ensuring transparent PNG backdrops do not skew the dataset.
- Clustering & Centroids: Median-cut quantization groups the remaining visible pixels into distinct geometric clusters in 3D RGB space.
- Frequency Counting: The algorithm counts the exact number of pixels assigned to each cluster centroid:
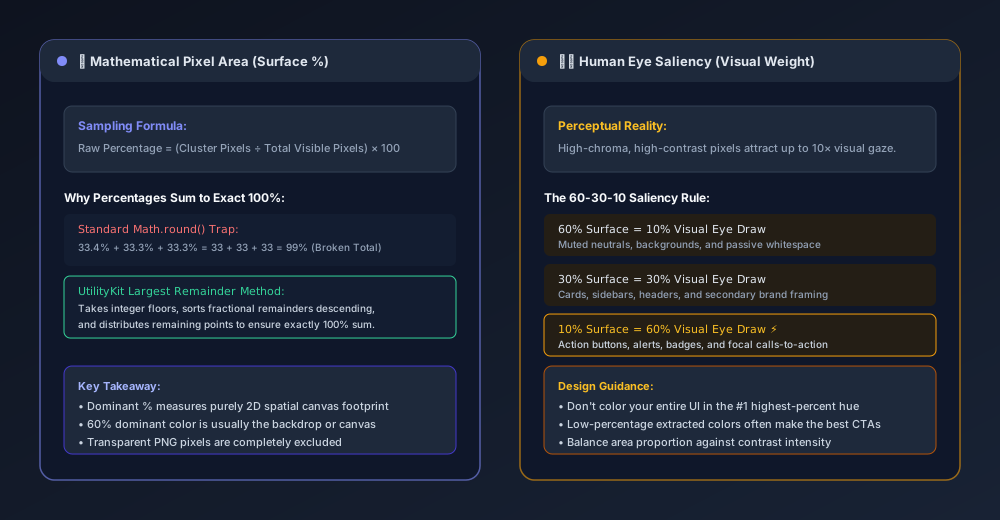
$$\text{Raw Percentage}_i = \left( \frac{\text{Pixels in Cluster}_i}{\text{Total Visible Analyzed Pixels}} \right) \times 100$$
If an analyzed image contains 20,000 visible pixels, and cluster #1 contains 8,800 pixels, its raw mathematical coverage is:
$$\frac{8,800}{20,000} \times 100 = 44.0\%$$
Why UtilityKit Percentages Always Sum to 100%
A common frustration with naive web tools is percentage drift. If an image has five colors with raw percentages of:
- Color A:
33.4% - Color B:
33.3% - Color C:
33.3%
Applying standard Math.round() rounds each value down to 33%, yielding an incorrect total of 99%. Conversely, multiple fractions ending in .6% can round up to 101%.
To eliminate this discrepancy, the UtilityKit color extraction engine uses the Largest Remainder Method (also known as the Hare-Niemeyer method):
// 1. Calculate floor integers and fractional remainders
const floors = rawPercentages.map(p => Math.floor(p));
const remainders = rawPercentages.map((p, idx) => ({ index: idx, remainder: p - Math.floor(p) }));

// 2. Determine difference from 100%
const currentSum = floors.reduce((acc, v) => acc + v, 0);
let diff = 100 - currentSum;

// 3. Sort remainders descending and distribute extra units
remainders.sort((a, b) => b.remainder - a.remainder);
for (let i = 0; i < diff; i++) {
  floors[remainders[i].index]++;
}
This guarantees that every displayed percentage is an accurate integer while strictly preserving a 100% total across all swatches.
Surface Area vs. Visual Weight (Saliency)
The most critical mistake designers make when working with extracted palettes is conflating surface area with visual importance:
Surface Area (The Machine's Perspective)
The extraction algorithm measures physical pixel counts. In a landscape photo of an ocean at sunset:
- The deep navy water might occupy 48% of the pixels.
- The twilight sky might occupy 32% of the pixels.
- The warm sandy beach might occupy 14% of the pixels.
- The intense neon-orange setting sun might occupy only 6% of the pixels.
Visual Weight (The Human Brain's Perspective)
Human vision does not process colors equally. High-chroma (intensely saturated) colors and sharp luminance contrasts immediately draw human visual fixation (a cognitive phenomenon known as visual saliency).
Even though the setting sun occupies only 6% of the image canvas, it captures 70% of your initial visual attention. If you were to design a website based on this image, making the whole page neon orange would be visually overwhelming.
Instead, professional UI designers map extracted percentages to the classic 60-30-10 Rule:
| Extracted Percentage Role | UI Token Mapping | Recommended Application |
| High Coverage (40% – 60%) | Canvas & Backgrounds (--bg-canvas) | Muted backdrops, page containers, passive whitespace |
| Medium Coverage (20% – 35%) | Structural Elements (--brand-primary) | Header bars, cards, navigation borders, typography framing |
| Low Coverage (5% – 15%) | Action Callout (--accent-cta) | Primary CTA buttons, notification badges, conversion triggers |
How to Work with Low-Percentage Accents
When reviewing your extracted palette in the Color Picker, pay close attention to the colors at the bottom of the list (those with 5% to 10% coverage).
These low-percentage swatches are frequently:
- The True Focal Point: The accent color deliberately placed in a photo or logo to make it pop.
- Ideal Button Colors: Because they naturally contrasted with the dominant background in the source image, they will provide excellent contrast in your UI layout.
- Harmonic Anchors: Selecting a low-percentage swatch and viewing its Complementary or Triadic harmony often reveals stunning pairing options for badges and tags.
Practical Takeaways
- Percentages measure area, not beauty: A 50% color is your atmospheric base, not necessarily your hero brand color.
- Transparent pixels are excluded: PNG and WebP transparency is safely ignored so that alpha margins never distort the percentage weights.
- Exact 100% balance: The Largest Remainder Method prevents rounding anomalies, ensuring reliable mathematical fidelity for design specs and client presentations.
Test your own photographs, screenshots, and logos with the UtilityKit Color Picker to see your pixel distributions in real time.
Frequently Asked Questions
Quick answers to common questions for users and search assistants
What does the percentage next to each extracted color represent?
Why do color percentages sometimes sum to 99% or 101% in other tools?
Does the color with the highest percentage have to be my primary website brand color?
Related Utilities Mentioned in This Guide
Browse directoryColor Picker & Palette Generator
Extract dominant colors from images and generate harmonic color schemes.
JSON Tools
Format, validate, view in a collapsible interactive tree, and visually edit JSON with draft safety.
Text Diff Checker
Compare two text snippets side-by-side and highlight additions, deletions, and changes.
Continue Reading
Complementary, Analogous, Triadic, and Split-Complementary Palettes
Master color wheel harmonies. Explore the mathematics behind complementary, analogous, triadic, and split-complementary schemes, and learn why wheel harmony does not guarantee WCAG accessibility.
How to Extract a Color Palette from a Photo or Logo
Learn how to extract dominant color palettes from photographs and vector brand logos using median-cut quantization, alpha filtering, and canvas sampling.